A few days ago, we showed you how changing plans in mid-air can be a good thing if the situation requires it. Fortunately, things are not always that complicated. Sometimes, just as the Elliott Wave theory postulates, a five-wave impulse is followed by a three-wave correction and that’s it. This is precisely what this year’s slide in EURUSD stands for.
Similar Elliott Wave setups occur in the crypto, commodity and stock markets, as well. Our Elliott Wave Video Course can teach you how to uncover them yourself!

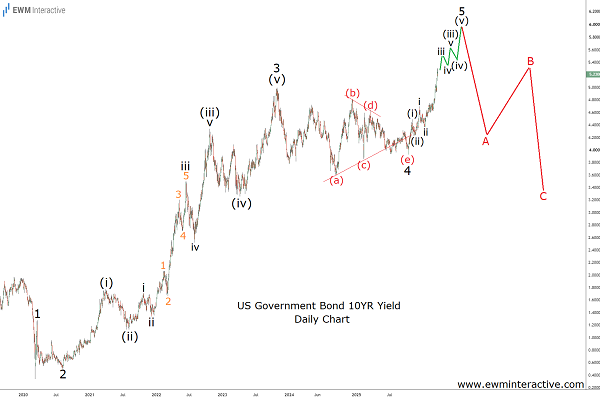
This chart was part of our Pro analysis of EURUSD published before the markets opened on January 26th. It revealed that the surge from 1.0178 was an impulse pattern, marked 1-2-3-4-5, whose fifth and final wave was still unfolding. The structure of wave 3 was also on display and wave 4 was a triangle, marked (a)-(b)-(c)-(d)-(e).
With the pair near 1.1830, this count implied that a new high in wave 5 near 1.2100 should be followed by a bearish reversal and a three-wave decline back to the support near 1.1400. More than five months later now, the updated chart below shows how things went.

EURUSD climbed to 1.2083 before the bullish momentum ran out. In late-June, the pair fell to 1.1325, down 6.3% from that five-year high. It didn’t move in a straight line, however, since wave B interrupted the decline to give it the usual three-wave structure, labeled A-B-C.
In this website we try to keep expectations realistic. Elliott Wave analysis is rarely that simple. Usually, one needs to keep at least one alternative count in mind, in case the primary idea begins to fail. But here, especially after seeing that big wave 4 triangle, which always precedes the final wave of the larger sequence, reaching the conclusion that a notable correction lied ahead was not that difficult.
In our Elliott Wave PRO subscriptions we provide analyses of Bitcoin, Gold, Crude Oil, EURUSD, USDCAD, USDJPY and the S&P 500 twice a week! Check them out now!