2017 was drawing to a close when we wrote an article about this relatively unknown apparel retailer on December 28th. The Buckle stock (NYSE:BKE) was trading near $24.50 after a four-month rally from as low as $13.60. But instead of falling in love with the recovery and joining the bulls, we decided to listen to the Elliott Wave Principle‘s advice and “get ready for a three-wave pullback.” The chart below, published almost three months ago, explains why.

The reason for our short-term bearishness was hiding in the impulsive structure of The Buckle stock’s rally. According to the theory, every impulse is followed by a three-wave correction in the other direction. In addition, the Relative Strength Index was showing a strong bearish divergence between waves 5 and 3 of the pattern, further reinforcing the negative outlook. Now, in the middle of March 2018, BKE stock is already knocking on the $18 mark.
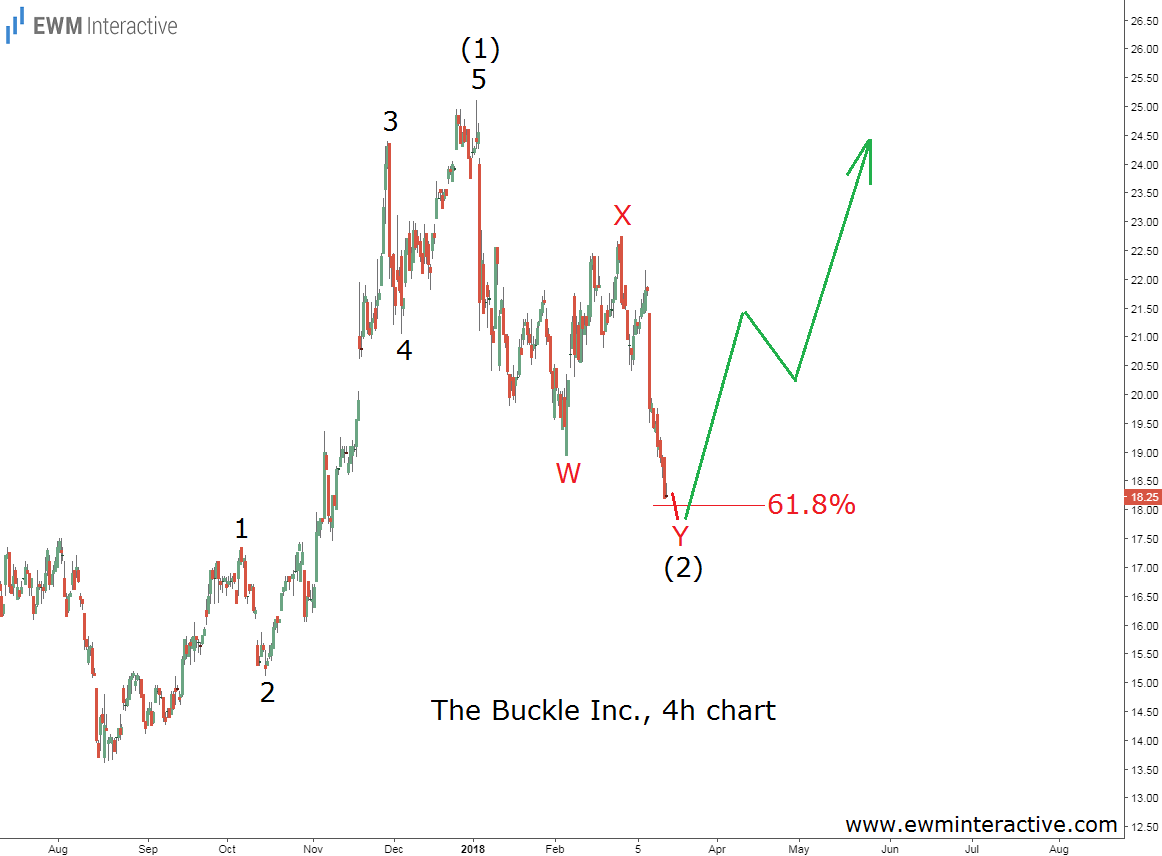
Instead of a simple A-B-C zig-zag, the bears drew a W-X-Y double zig-zag in the position of wave (2), which carries practically the same consequences. It is also interesting to note that the bears have reached the 61.8% Fibonacci support level just when The Buckle is about to release its Q4 and full fiscal 2018 earnings report on March 16th.
Of course, there is no way to know what this report will bring, but the Wave principle suggests investors’ reaction to it is likely to be positive, since the stage is already set for a surge in wave (3), whose targets lie way above the $25.10 top of wave (1). Nevertheless, the outlook for Buckle stock remains positive as long as it trades above $13.60, even if tomorrow’s report disappoints and the rice dips below $18.00. Despite the recent weakness, future is still bright for The Buckle shareholders.