As with many other financial institutions, recovering from the 2008 recession wasn’t easy for Piper Sandler. The stock only stopped falling in September, 2011, two and a half years after the broader equity market had found its bottom. And just when it looked like PIPR investors were finally out of the woods, Covid-19 crashed the share price back to 2008 levels.
The uptrend which then followed was well worth waiting for, however. Currently above $66 per share, Piper Sandler stock is up more than eight-fold since mid-March, 2020, despite being down 22% this year. The question is, should we buy the dip or brace for an even bigger decline? The chart below helps us to put it all in Elliott Wave context in order to find the answer.
Similar Elliott Wave setups occur in the Forex, crypto and commodity markets, as well. Our Elliott Wave Video Course can teach you how to uncover them yourself!
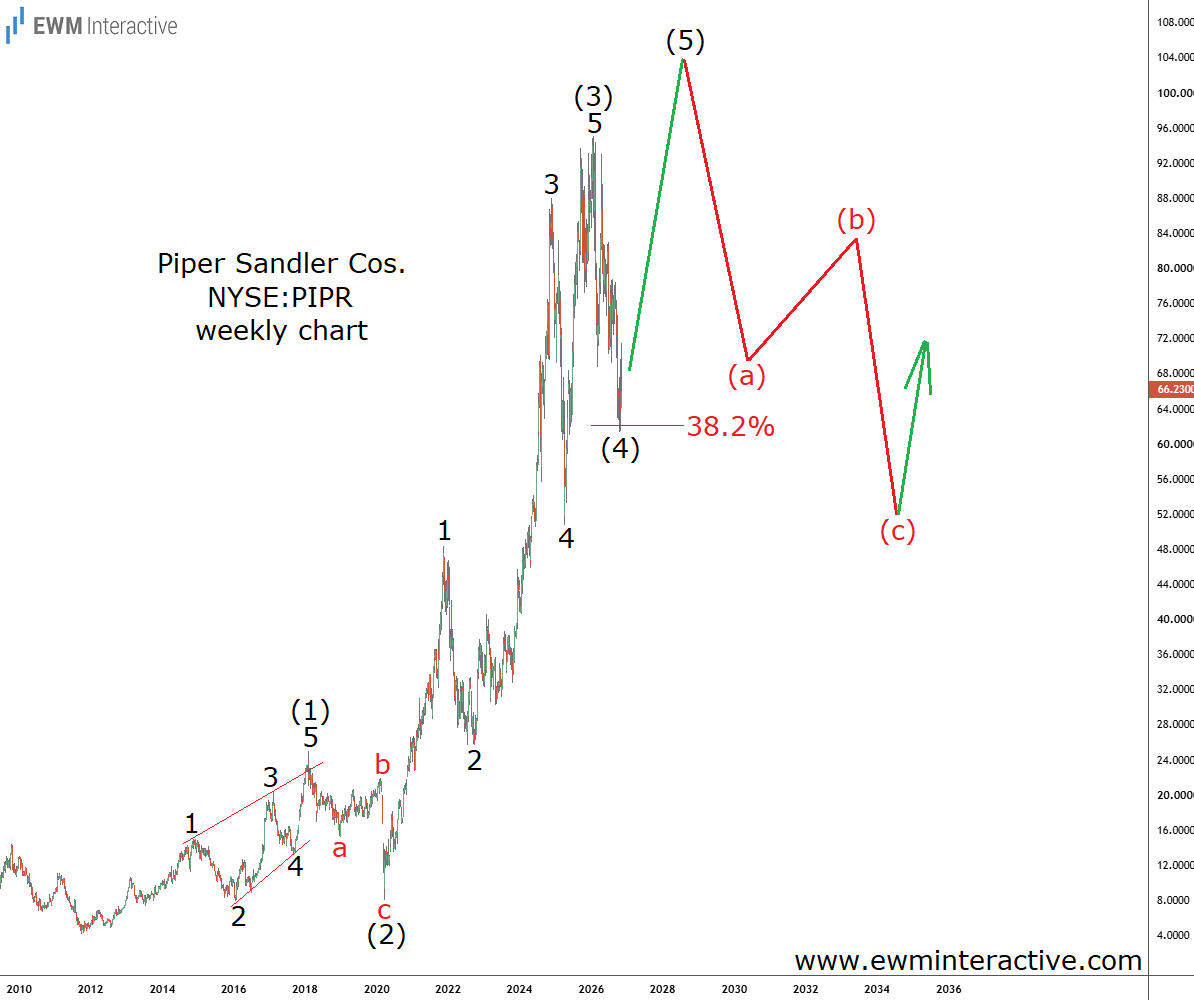
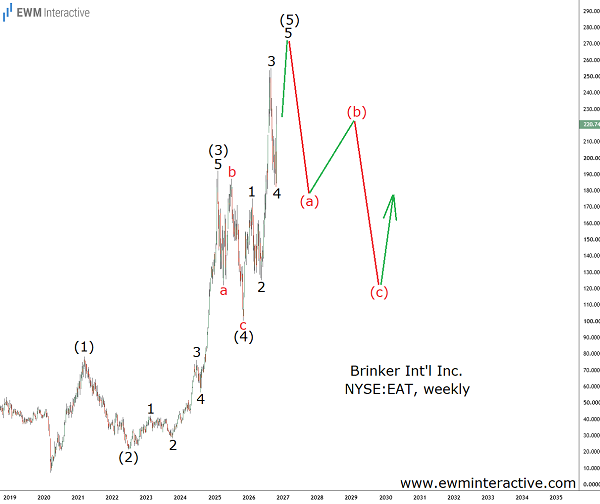
It reveals that Piper Sandler’s uptrend has been progressing according to the rules of the Elliott Wave principle. The slow recovery between 2011 and 2018 was a leading diagonal in wave (1). It was followed by a simple a-b-c zigzag correction in wave (2), culminating in the Covid-19 panic of early-2020.
The stock then drew a textbook impulse pattern, marked 1-2-3-4-5 in wave (3), which traveled from $8 to $95 in less than six years. The 2026 drop should then be wave (4), which has already dragged Piper Sandler to the 38.2% Fibonacci support level. If this count is correct, we can expect one last surge in wave (5) to a new all-time high in 2027.
Once the pattern is complete, however, the theory tells us to expect a three-wave move in the opposite direction. Assuming a bearish reversal near the $100 mark, a ~50% decline back to the support near $50 a share could be lurking around the next corner.
In our Elliott Wave PRO subscriptions we provide analyses of Bitcoin, Gold, Crude Oil, EURUSD, USDCAD, USDJPY and the S&P 500 every Sunday and Wednesday! Check them out now!