A year ago, the market cap of BNB, also known as Binance coin, seemed to be on its way to $200B. Twelve months later now, it is less than $100B, despite the recovery from $537 in July to over $740 as of this writing. This still makes it the fourth biggest cryptocurrency, but the bulls will not be happy with the almost non-existent progress they’ve made since 2021. Unfortunately for them, the daily chart of BNB reveals an Elliott Wave pattern suggesting that the recent rally is unlikely to last long.
Similar Elliott Wave setups occur in the Forex, commodity and stock markets, as well. Our Elliott Wave Video Course can teach you how to uncover them yourself!
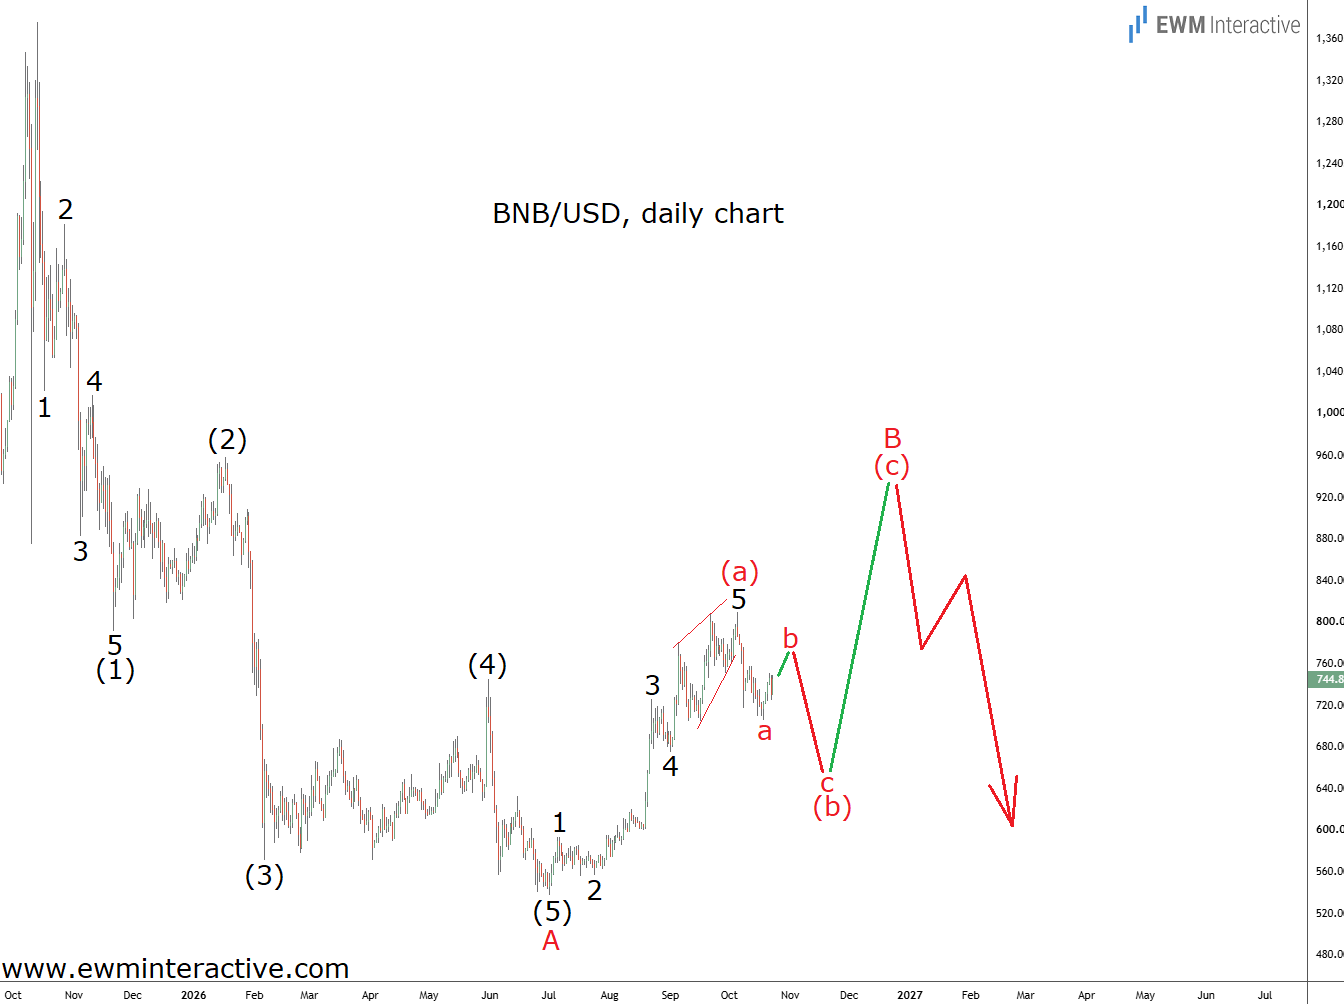
The sell-off from last year’s record high at $1376 down to $537 can easily be seen as a five-wave impulse. We’ve labeled the pattern (1)-(2)-(3)-(4)-(5) in wave A, where the five sub-waves of wave (1) are also visible. The theory states that a three-wave correction follows every impulse and that’s what we think is now in progress in wave B.
The recovery from $537 to $810 earlier this month is another impulsive structure in what must be wave (a) of B. If this count is correct, waves (b) down and (c) up have yet to take place. The resistance of wave (2) just under $1000 looks like a reasonable mid-term bullish target. Once there, however, the 5-3 wave cycle would be complete and the bears should return in wave C. When they do, downside targets below $500 would make sense for BNB coin against the US dollar.
In our Elliott Wave PRO subscriptions we provide analyses of Bitcoin, Gold, Crude Oil, EURUSD, USDCAD, USDJPY and the S&P 500 every Sunday and Wednesday! Check them out now!