Three years ago, in mid-April 2015, Mylan stock was trading in the vicinity of $77 a share following a phenomenal rally from as low as $5.75 in late-October 2008. Currently above $40, Mylan (NASDAQ:MYL) is trying to recover from its 61.7% selloff which dragged the share price to $29.39 by August, 2017. Would the bulls be able to recover or simply fall into another bearish ambush? Let’s see if we could find the answer to this question with the help of the Elliott Wave Principle. Our analysis begins with the weekly price chart of Mylan stock below.
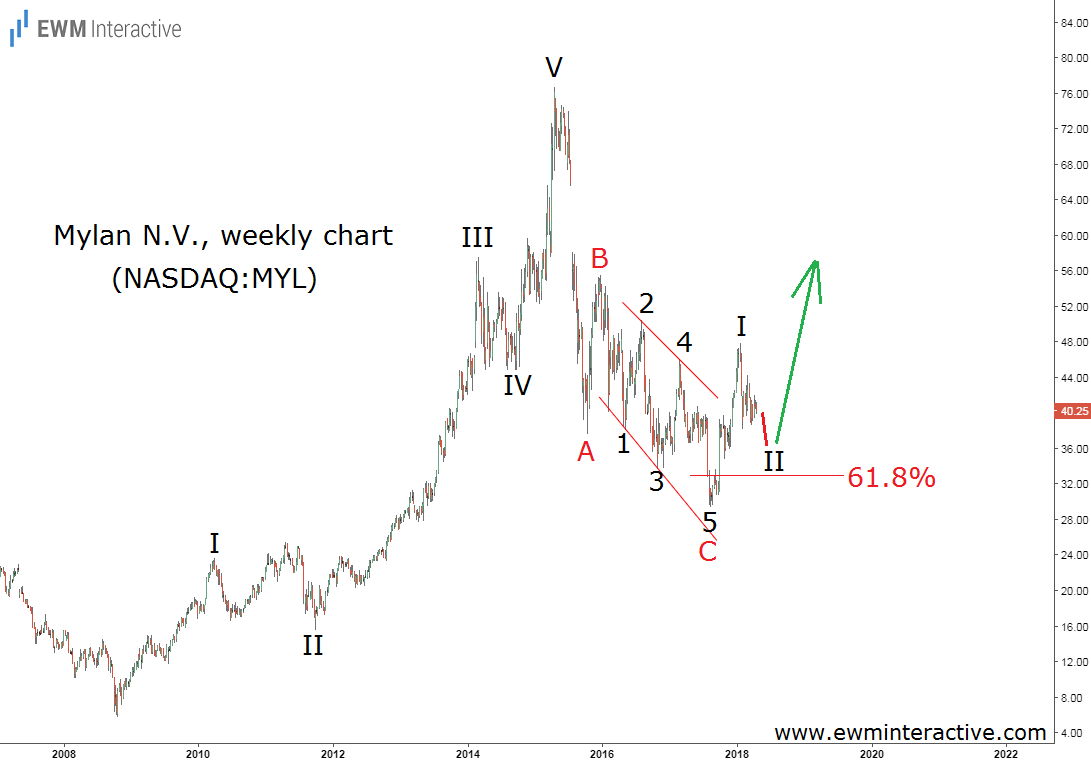
This chart shows that the bull market from $5.75 to $76.69 has developed as a five-wave impulse pattern, labeled I-II-III-IV-V. The market took the guideline of alternation into account, since wave II looks like an expanding flat correction, while wave IV is much sharper. According to the theory, every impulse is followed by a three-wave correction in the other direction. Naturally, Mylan’s decline to $29.39 looks like a simple A-B-C zigzag retracement, whose wave C is an expanding ending diagonal. The 61.8% Fibonacci level has been breached slightly, but it still managed to help the bulls out and lead Mylan stock to $47.82 in January, 2018. Now let’s move on to the 4-hour chart of MYL and see if we can trust this recent strength.
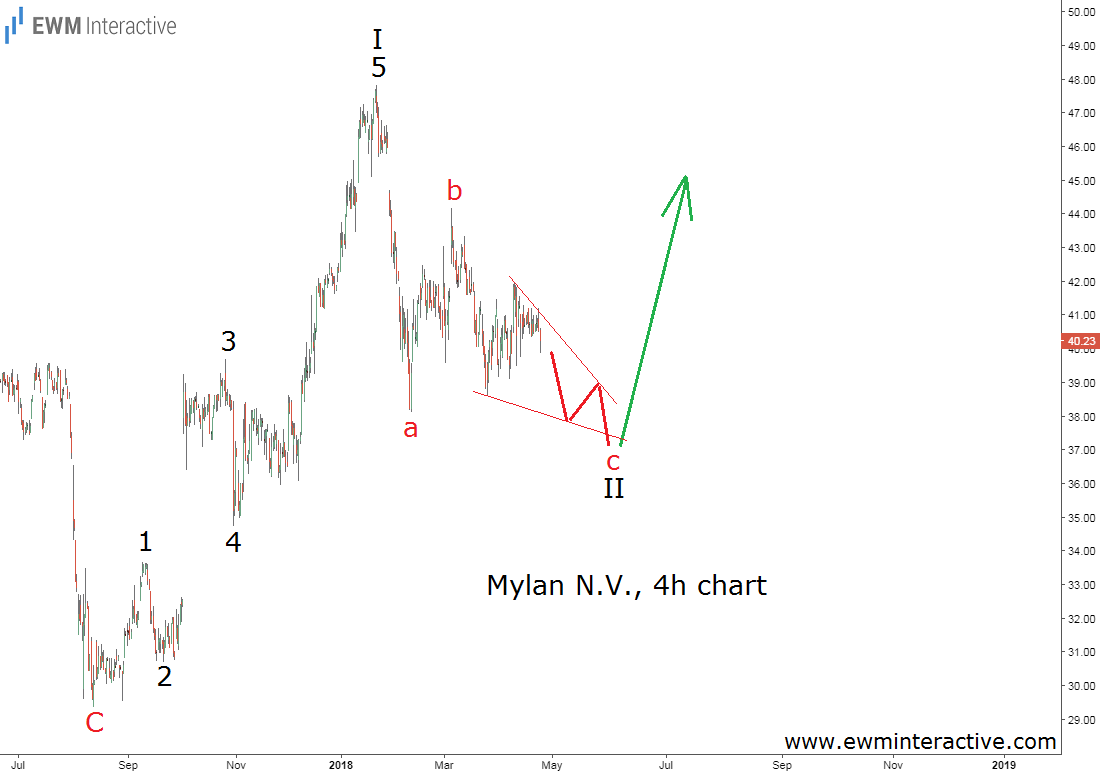
The rebound from $29.39 to $47.82 has a five-wave structure, as well. Wave 3 is not the longest among waves 1, 3 and 5, since wave 5 is extended, but it is still longer than wave 1, so there is no violation of the Wave principle’s rules. If this count is correct, Mylan stock is in another a-b-c zigzag in wave II, whose wave “c” is still under construction. However, despite all the pain Mylan shareholders had to suffer during the last three months, and the last three years if we consider the bigger picture, the stock’s weekly and hourly charts both point up. This means that as long as the bottom at $29.39 holds, this drug manufacturer’s future remains bright, at least according to the charts.