In about six short months between May and November 2017, Foot Locker lost over 63% of its market capitalization. The retail crisis did not spare FL stock, which crashed from $77.71 on May 10th to $28.42 by November 8th last year, following misses in earnings and revenue in the first two quarters of fiscal 2018.
However, the stock nearly doubled to $53.17 by January 25th, 2018, before plunging to $38.17 again on March 2nd. While Foot Locker is still searching for direction around $45.50, it is a good time to ask the Elliott Wave Principle if this beaten-down company is worth buying now. The chart below provides a straight answer.
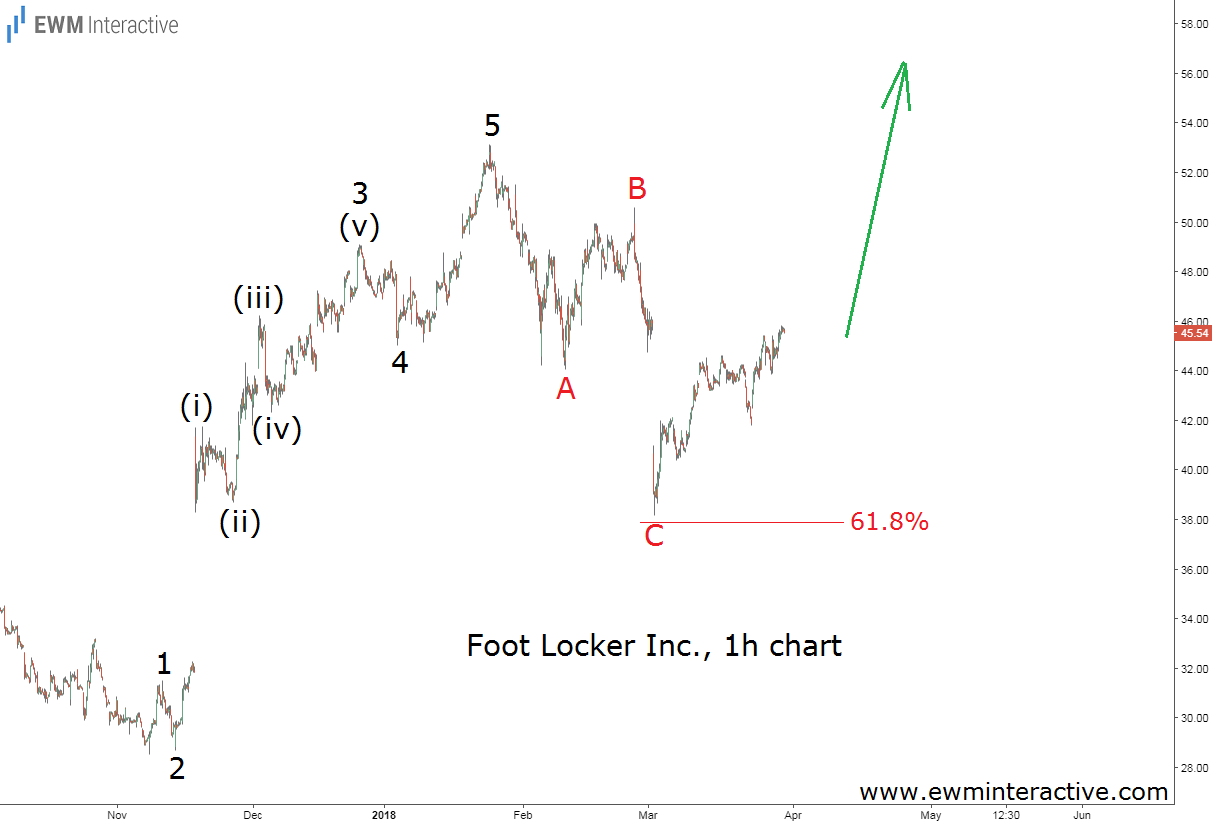
The hourly chart of FL visualizes the last five months for us. It shows the impulsive structure of the recovery from $28.42, as well as the following three-wave A-B-C decline. It is interesting to note that while wave 3 is the longest among waves 1, 3 and 5 of the impulse pattern, wave (i) is the extended one within wave 3. Also, pay attention to how precisely the corrective phase of the Elliott Wave cycle has found support in the 61.8% Fibonacci level.
All this leads us to the conclusion that the worst is over for Foot Locker shareholders. From an Elliott Wave perspective, this profitable, low-debt sporting goods retailer looks like a good choice for investors looking to “buy at the point of maximum pessimism” as the great Sir John Templeton once said.
Disclaimer: The author holds a long position in Foot Locker stock.