
In late-March 2019 we published an analysis, stating that Chipotle bulls were aiming at $900 a share. The stock was hovering around $700 at the time, but the momentum it was gaining made us confident it can rise some more. The Elliott Wave chart our confidence stemmed from is given below.

Following a perfect 5-3 wave cycle to the upside in waves (1) and (2), Chipotle was in a strong uptrend in wave (3). The 161.8% Fibonacci extension was a natural target for the third wave, so initial targets near $850 a share made sense.
Then, after a short-term pullback in wave (4), wave (5) was supposed to lift CMG stock towards $900. Less than a year later, Chipotle closed at $922 on February 14th, 2020. What lies ahead remains unknown, but the updated chart below can give us some hints.
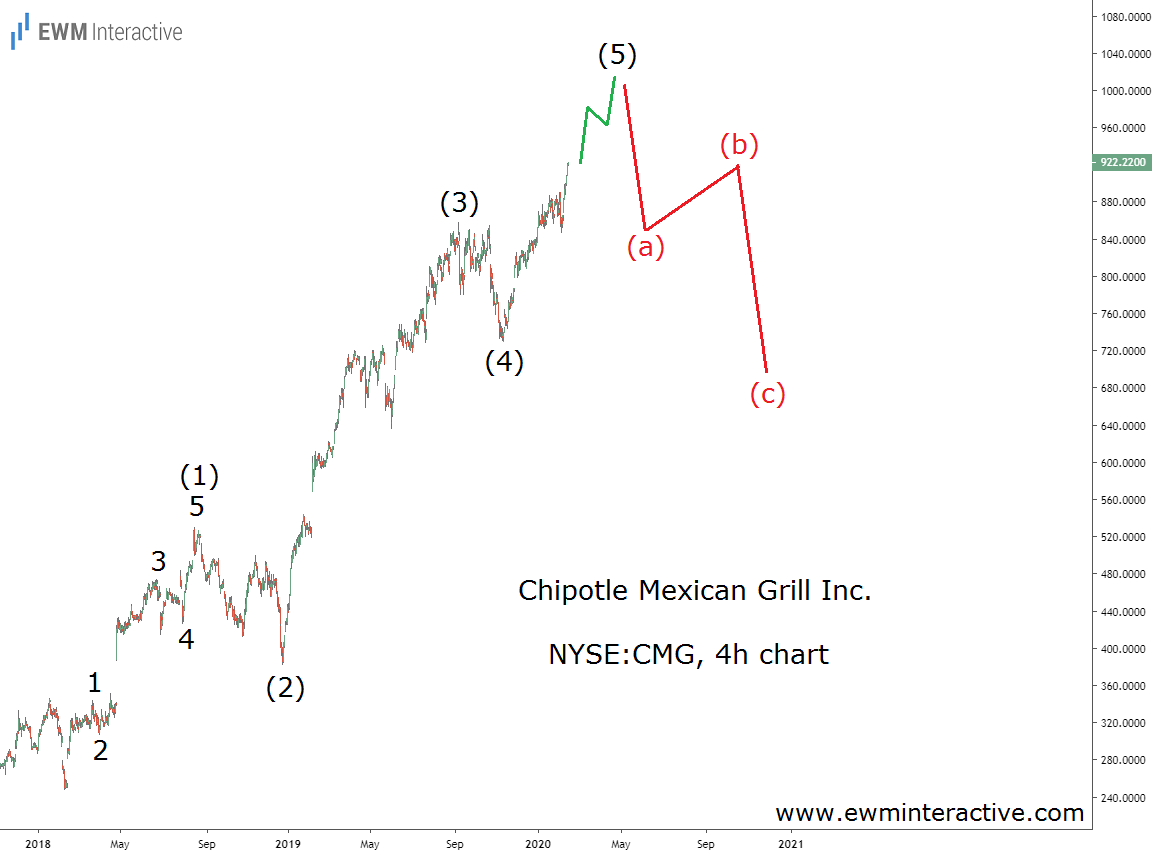
Wave (3) reached $858 before the price fell to $728 in wave (4). If this count is correct, the new all-time high must be part of the fifth and final wave. The Elliott Wave principle states that a three-wave correction follows every impulse.
The bulls are still in charge for now and $1000 is there for grabs. However, once wave (5) is over, a notable retracement back to the support of wave (4) can be expected. In terms of price, this would be a 30% drop to ~$700. Given Chipotle’s already stretched valuation, we cannot rule out an even bigger decline.
Similar Elliott Wave setups occur in the Forex, crypto and commodity markets, as well. Our Elliott Wave Video Course can teach you how to uncover them yourself!






