
Ford stock holders did not have a lot of reasons to celebrate in recent years. The stock climbed to $18.12 in July 2014, but has been sliding ever since. To make matters worse, 2018 brought a decline from $13.48 in January to as low as $8.17 last month. Ford stock closed at $9.25 yesterday, which means shares are down 26% year-to-date, significantly trailing the S&P 500’s 0.6% YTD return.
However, Ford stock’s weakness is not a big surprise to Elliott Wave analysts. In fact, over two years ago, on August 30th 2016, we published an analysis suggesting the company could lose over 30% of its valuation. F was hovering around $12.50 back then. Take a look.

The weekly chart of Ford stock indicated the bears were drawing the third wave of a simple (a)-(b)-(c) zigzag correction. The 61.8% Fibonacci level looked like a reasonable target, which in terms of price meant “levels around 8 dollars a share.” The updated chart below shows the stock price’s path to $8.17 a share so far.
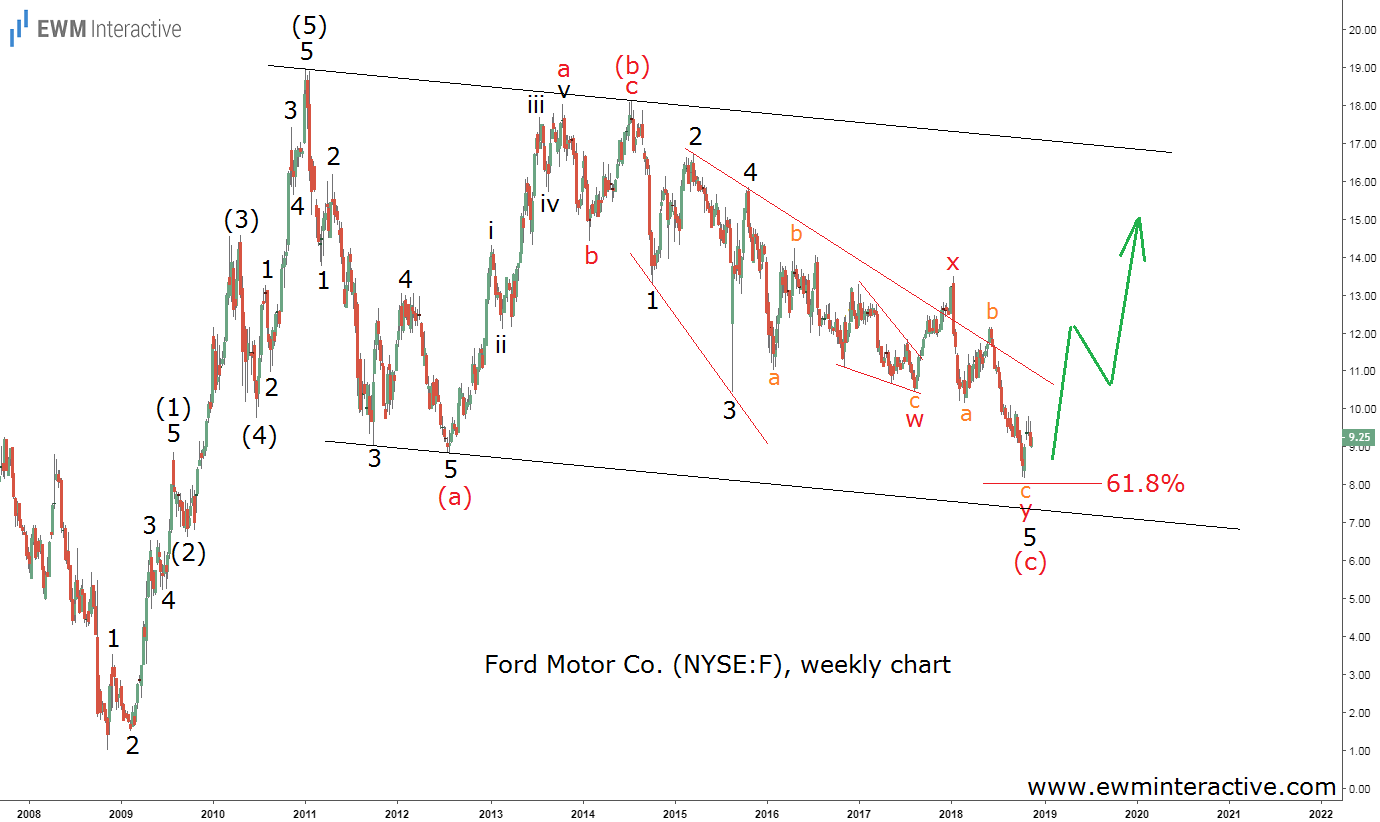
Wave (c) does not look like the contracting ending diagonal we have been anticipating, but it can be seen as an expanding one. Is the long-term positive outlook still valid then? In one word – yes.
Ford Stock Looks Better Going into 2019
We still have enough reasons to take a bullish stance on Ford stock. First, the 5-3 wave cycle points to the upside. Second, the 61.8% Fibonacci level and the lower line of the corrective channel drawn through the extremes of wave (5), (a) and (b) create a support cluster near $8 a share.
If this count is correct, there is light at the end of the tunnel for Ford shareholders. The bulls can be expected to step up soon and lift Ford to or above $20 share in the next few years. Even if it takes the stock 5 years to get there, this still means annual returns of over 20% going forward.
Given the cyclical and highly competitive industry it operates in, Ford is far from a great business. At $9 a share, however, we think it is definitely worth the risk.
Did you like this analysis? Our Elliott Wave Video Course can teach you how to uncover similar opportunities yourself!






