Another week, another bloodbath for Bitcoin. The largest cryptocurrency climbed to $6815 on Monday, but the bulls quickly lost control and suffered a sharp plunge to $6072 four days later on Thursday. And while bullish predictions by crypto “experts” still call for $60 000 by the end of the year or $280 000 by 2023, we prefer to rely on the messages the market always leaves for those who know what to look for – Elliott Wave patterns.
On Sunday, July 8th, we sent the latest portion of seven analyses to subscribers. The analysis of Bitcoin included the following chart.
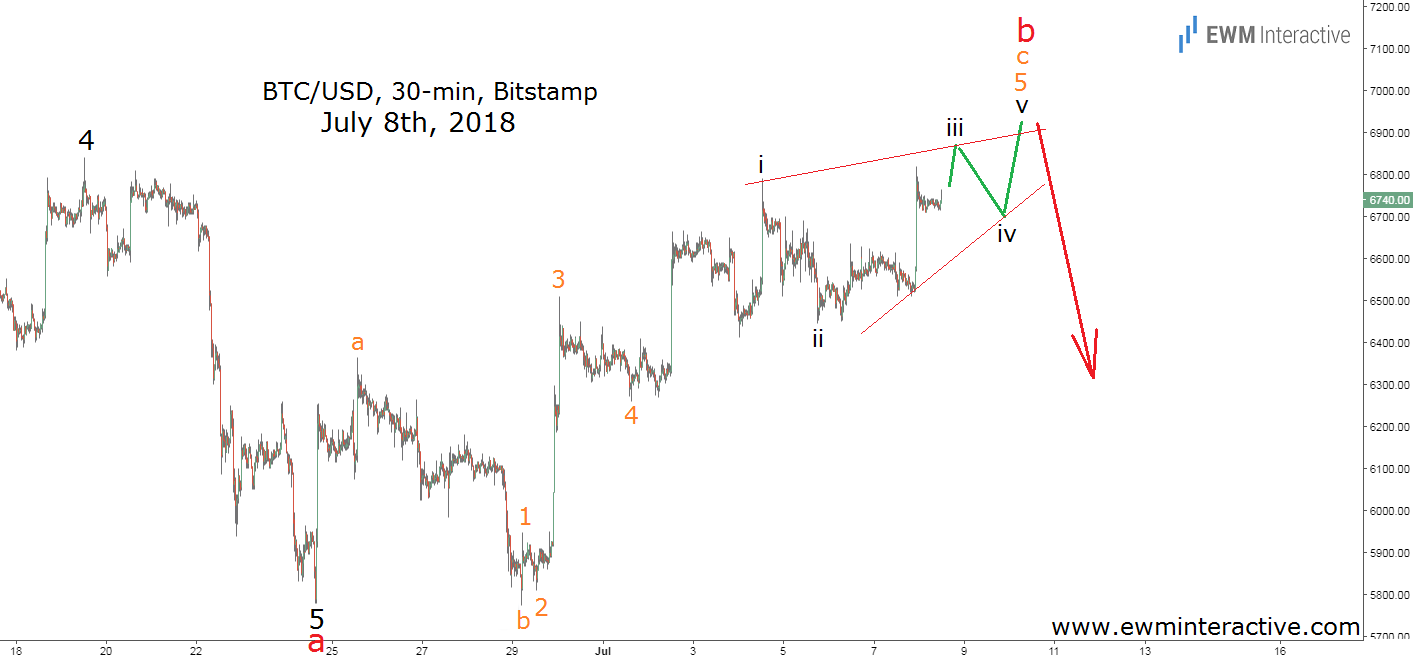
As visible, we assumed BTCUSD might reach a new swing high, but it was definitely not a good time to join the bulls, because a major bearish reversal had to be expected. The logic leading to this negative outlook was simple:
1) The bigger picture indicated Bitcoin was still in a downtrend.
2) Therefore, the recovery from $5780 was just a short-term correction.
3) Once a correction ends, the larger trend resumes.
Furthermore, the Elliott Wave structure of this corrective rally formed a flat correction, whose wave c-orange was almost over. In addition, there was a solid resistance in the zone between $6700 and $7000, which made the bearish idea even easier to accept. The updated chart below shows how Bitcoin has changed six days after the analysis.
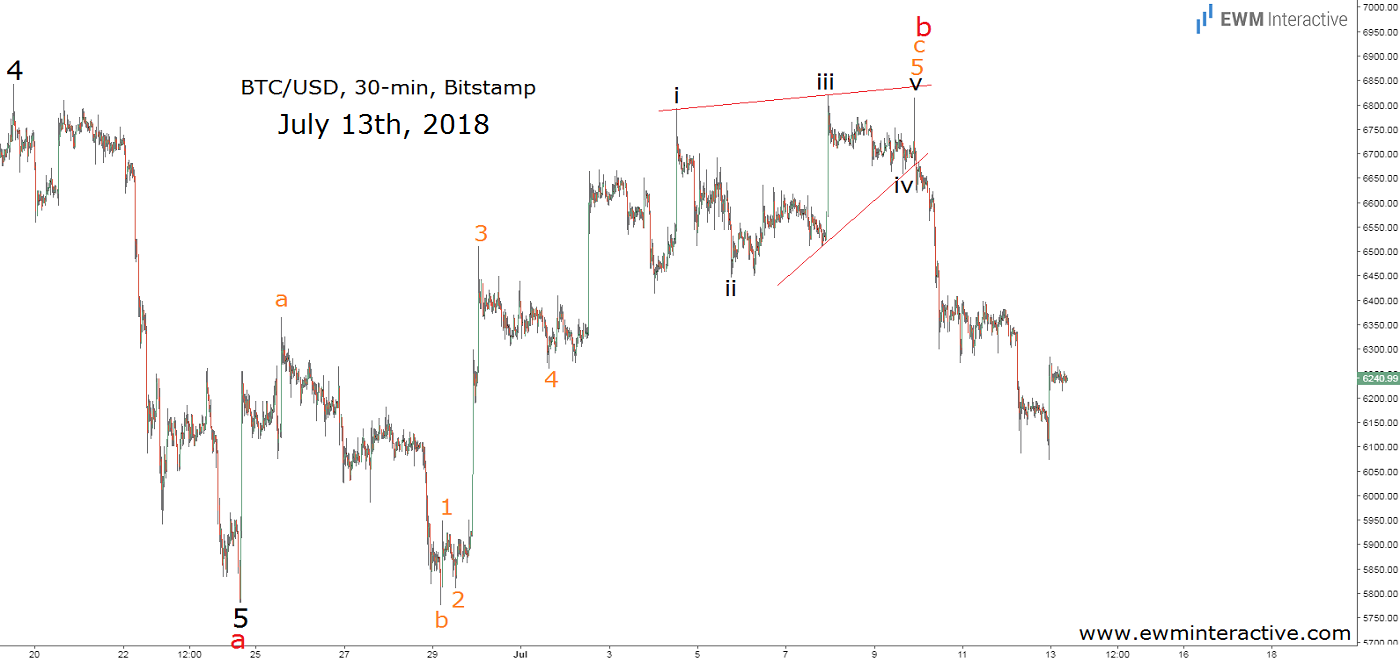
Bitcoin is well known for its volatility and the latest selloff is no exception. BTC lost almost 11% in just a week and while such a decline is hardly a big deal to crypto traders, who are used to sharp plunges, it is also true that it is always better to have an idea of what’s to come.
What will Bitcoin bring next week? That is the subject of discussion in the next premium analysis due out late-Sunday!