2018 has not been very kind to 3M stock investors. The share price was hovering in the vicinity of $260 in January. Fast-forward to October 26th , it was down to $181.98 for a 30% plunge in just ten months.
Now let’s take a look at the 4-hour chart of 3M stock, which we shared with you on June 22nd, and see how the Elliott Wave Principle helped us stay ahead of recent developments.
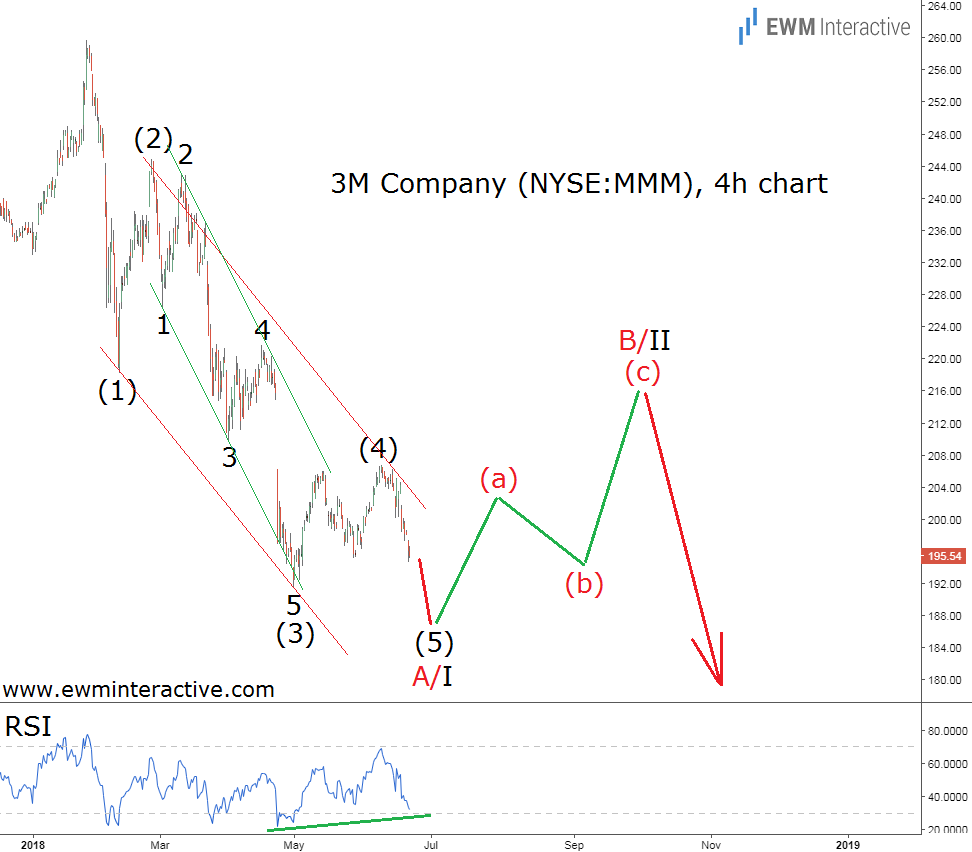
Five months ago, MMM was still holding above $195 a share. The decline from $260 looked like a five-wave impulse, whose wave (5) was poised to make a new low and complete wave A/I. A three-wave correction in the other direction was then supposed to lift 3M stock to roughly $220 in wave B/II, before the bears return in wave C/III. The updated chart below shows how things went.
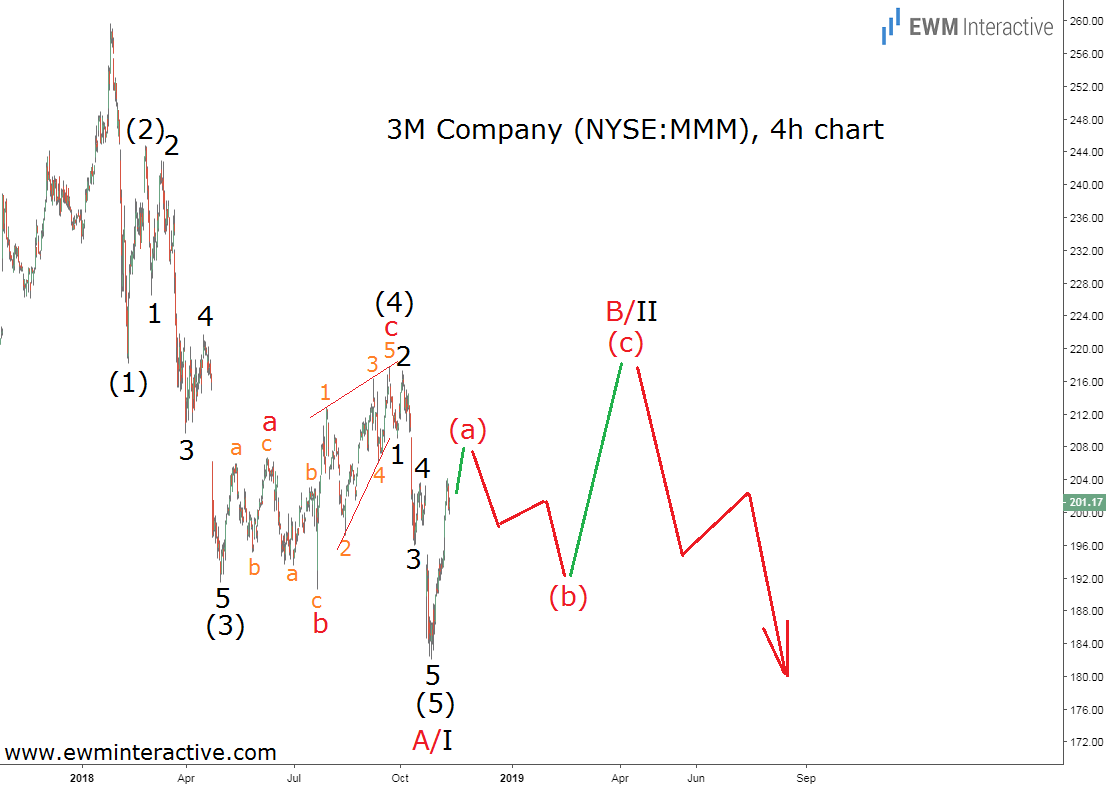
As expected, 3M stock made a new low at $190.57, then rose to $217.87 and plunged again to $181.98. In other words, the Wave principle managed to put us ahead of not one, not two, but three consecutive moves in MMM stock. Good.
3M Stock Demands a New Elliott Wave Count
However, it turns out that none of the three was labeled correctly. The drop to $190.57 was supposed to be wave (5), but only had three sub-waves. The recovery to $217.87 was supposed to be wave B/II, but was actually an ending diagonal. Which leads us to the conclusion that the selloff to $181.98 wasn’t wave C/III either.
The new labeling we’d like to propose suggests the entire decline from $260 to $182 is a five-wave impulse in wave A/I. Waves (2) and (4) obey the guideline of alternation as wave (2) is a sharp rally, while wave (4) is an expanding flat correction. The five sub-waves of (3) and (5) are clearly visible, as well.
This makes us think the current jump from $181.98 to $204.27 so far is the beginning of wave B/II. The same logic applies here. A three-wave rally to the resistance of wave (4) near $220 can be expected, followed by another selloff to $180 or lower.
In conclusion, an impulsive decline indicates 3M stock has entered a downtrend. Lower levels can be expected in the long-term. The short-term outlook should provide investors with another chance to evacuate near $220 a share.
Did you like this analysis? Our Elliott Wave Video Course can teach you how to uncover similar dangers (and opportunities) yourself!