GoPro made its IPO on June 25th, 2014. Investors obviously liked it, because less than four months later GoPro soared to as high as 98.40. However, the bulls were unable to keep their momentum and prices began a sharp decline. One GoPro share costs less than $65 today.
These figures alone cannot tell us more than what we already know. That GoPro has been in an uptrend for a while, but is currently in a downtrend. In order to make a forecast, we will need a little more than that. We need the Elliott Wave Principle and a chart to apply it to.

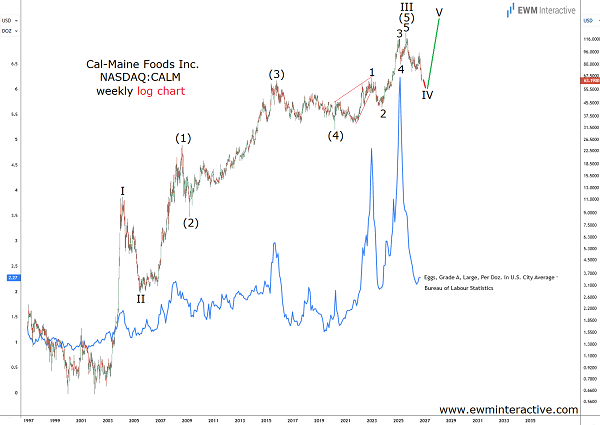
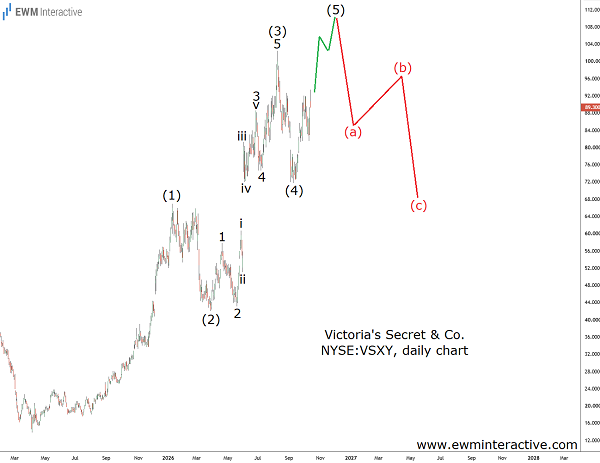
The Elliott Wave Principle’s subject of analysis is the structure of the price action visible on a chart. It postulates, that trends move in waves. The classical 5-3 Elliott Wave cycle consists of five waves in the direction of the larger trend, followed by three waves against it. This is exactly what we see on the 4-hour chart of GoPro. The post-IPO rally up to above $98 can easily be counted as a five-wave impulse, while the decline after it looks pretty much like a three-wave A-B-C correction. According to the theory, the trend should be expected to resume in the direction of the five-wave sequence. If this is the correct count, investors should not underestimate GoPro.