This week’s crash in the price of Bitcoin dragged virtually all other cryptocurrencies down with it. The total capitalization of the entire crypto market was down by almost $400 billion at one point on January 17th. Dash, currently the eleventh largest virtual currency, was no exception, falling from a high of $1247 to as low as $610 during the ten terrible days between January 7th and January 17th.
However, DSHUSD’s 51% crash did not come out of nowhere. The following Elliott Wave chart was included in an article, titled “Dash Intraday Pattern Points South, published on January 3rd.

As visible, while Dash was approaching the $1100 mark, the 5-3 wave cycle we thought was developing suggested we could expect a new swing high near $1300. On the other hand, as long as the pair traded below the starting point of the five-wave impulse at $1569, the bears were going to remain in charge. In other words, a bearish reversal was likely to occur once wave Y of (2/B) was over. The updated chart below shows how things went.
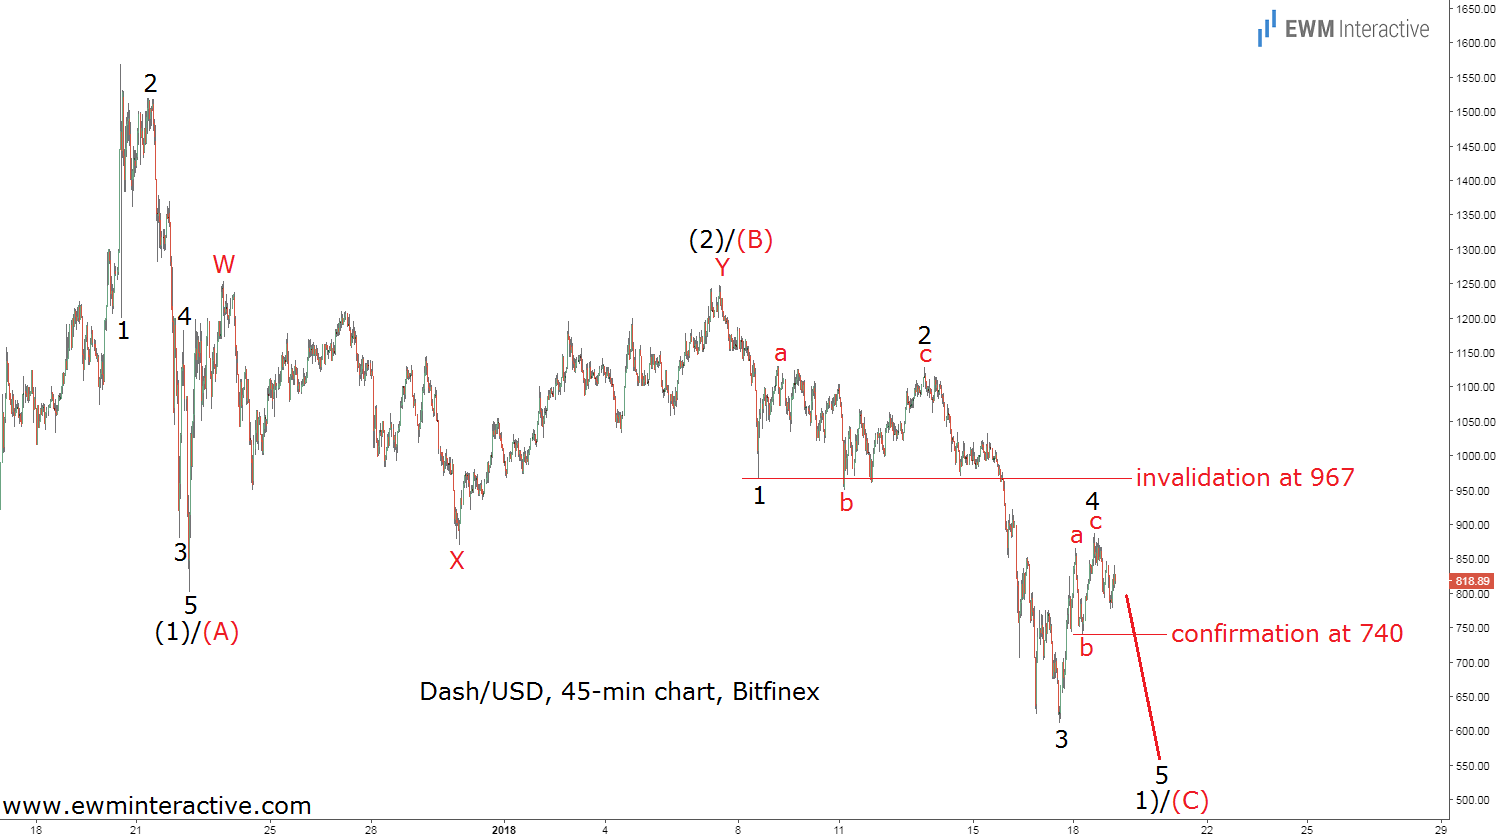
As already mentioned, DSHUSD could not even reach the $1300 mark. The best the bulls were capable of was $1247 by January 7th. From then on, the bears slowly took over and totally stole the show ten days later. This leads us to the present as the Dash is hovering around the $800 as of this writing, after recovering from $610 to $887.
If we stick to the primary count above, we could still expect the pair to breach $600. The decline from $1569 to $801 has the structure of an impulsive pattern and we should anticipate another one to occur in wave 1)/(C), whose wave 5 is still missing. Waves 1 and 4 of 1)/(C) cannot overlap, which means the bottom of wave 1 at $967 is going to be our invalidation level for this bearish scenario. As long as the Dash trades below this key level it remains under pressure.
On the other hand, if the bulls manage to lift DSHUSD above $967, we would be forced to switch to the alternative scenario shown below.
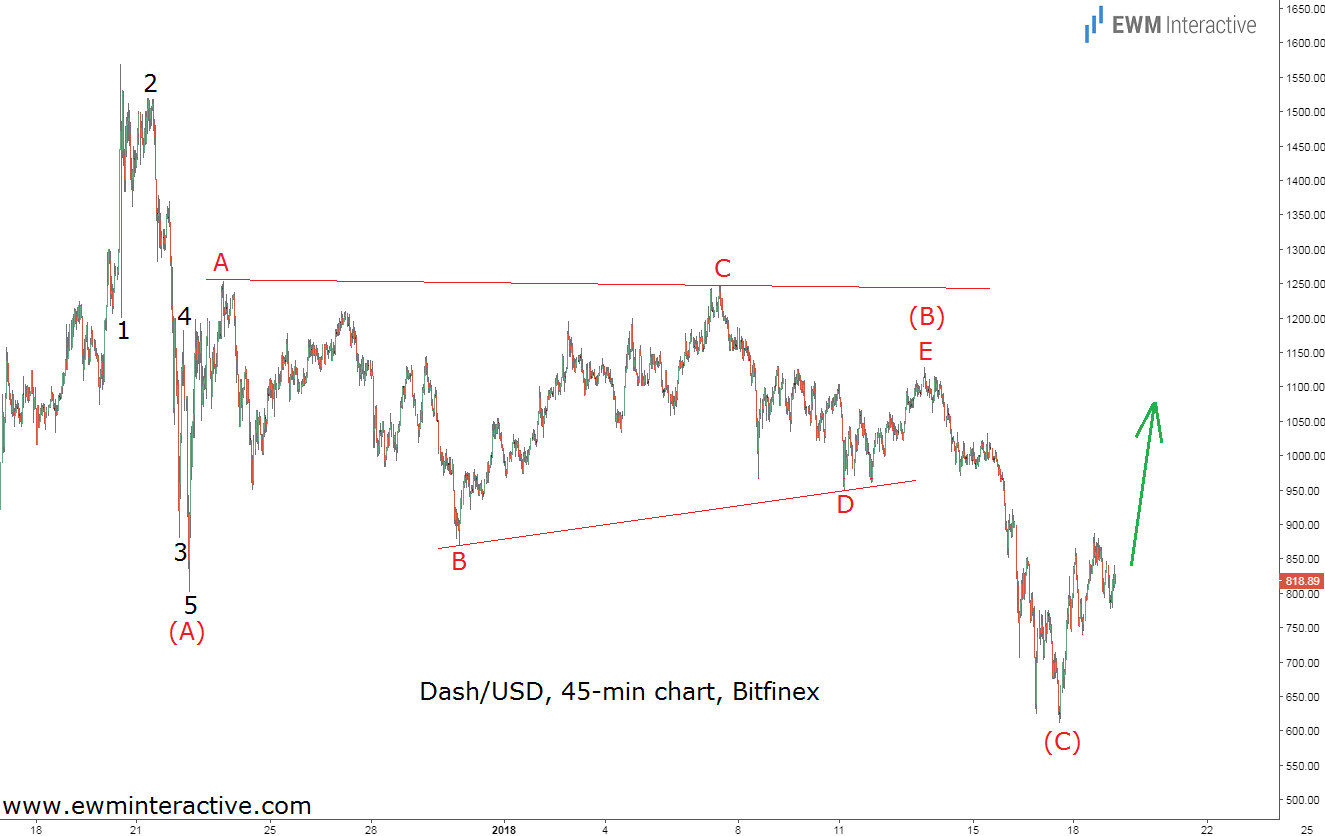
Ideally, within a W-X-Y double zig-zag recovery wave Y would exceed the top of wave W. Unfortunately, Dash’s wave Y fell $6 short of the top of wave W, which leaves the possibility that the entire selloff between $1569 and $610 is actually a simple (A)-(B)-(C) zig-zag with a triangle in the position of wave (B). If that is the case, $610 would turn out to be a major bottom as the uptrend resumes. That is precisely why $967 is so important. If the bulls breach it, the primary count would be eliminated and the alternative bullish one would be the one to rely on. Once $967 is no longer an obstacle, the Dash might even climb to a new all-time high near $1600, so pay attention to this level.