Our first and so far only article about Advanced Micro Devices Inc. was published on January 4th, 2018, when AMD stock was hovering around $11.55 a share. Back then the Elliott Wave analysis of AMD’s daily chart made us think the cryptocurrency mining boom was going to propel the stock price to a new high above $15.55, giving it at least 35% upside potential. A little over 8 months later, the stock is up 190% year-to-date, easily beating the S&P 500’s 7.6% YTD return. Let’s see how did that happen.

By early-January it looked like there was a complete 5-3 wave cycle on the daily price chart of AMD stock. A five-wave impulse from $1.61 to $15.55 was followed by a three-wave A-B-C flat correction with an ending diagonal in wave C. The theory states that once the corrective phase of the cycle is over, the trend resumes in the direction of the impulsive sequence. So, it made sense to stay the course and expect more strength from AMD going forward. As the updated chart below shows, we were not optimistic enough.
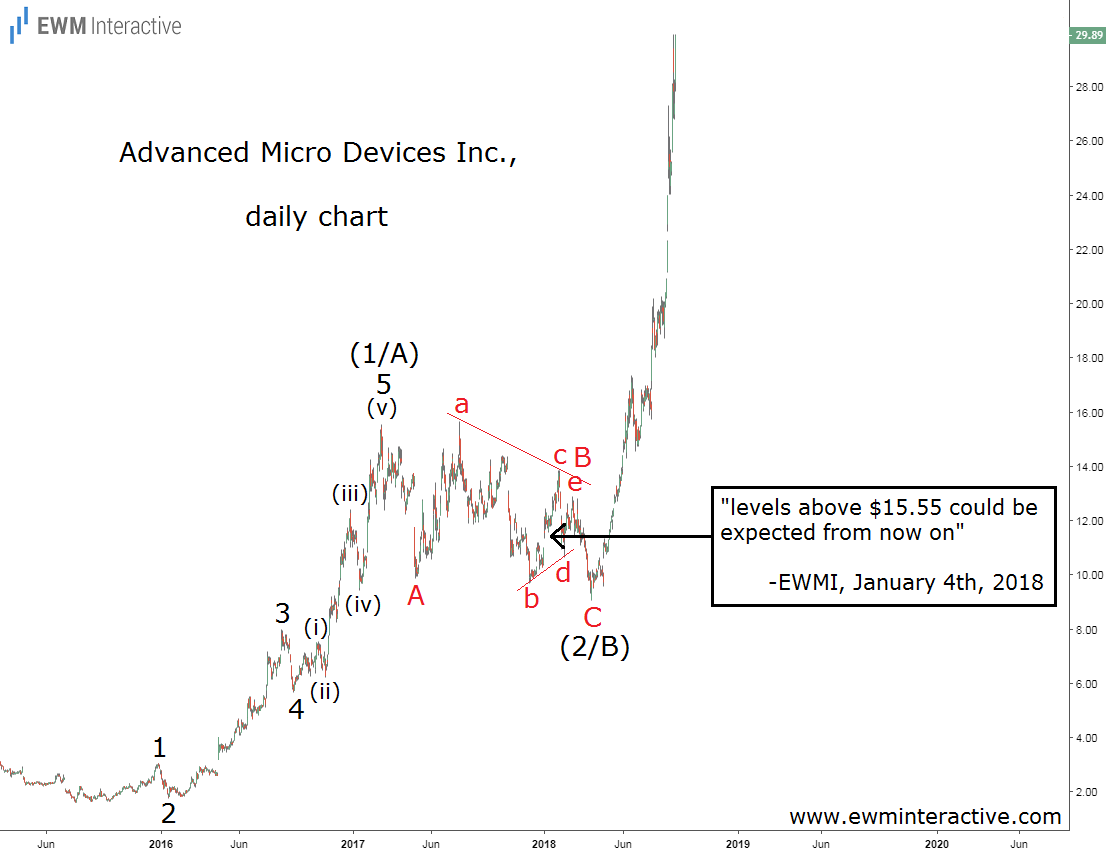
AMD stock’s surge did not start right away, though. It turned out wave (2/B) was still in progress as a simple A-B-C zigzag with a triangle in the position of wave B. However, the fact that investors had to wait a little longer did not change the positive outlook at all. The stock fell to a bottom at $9.04 a share on April 4th and has been under bullish jurisdiction ever since.
Currently approaching the $30 a share mark, Advanced Micro Devices is now attracting the attention of both large and small investors, who seem to believe the best is yet to come. A brief look at AMD’s weekly chart tells a different story.

The historical chart of AMD looks more like a cardiogram than a great growth story. The industry AMD operates in, namely semiconductors, is known to be highly cyclical and not in the Elliott Wave sense of the word. This means we cannot rely so heavily on the Elliott Wave principle to keep us ahead of the market in the long-term. The industry simply does not allow the forming of large enough trends. Several good business years are followed by roughly the same number of bad years, which results in AMD going practically nowhere in the long-term.
As the weekly chart shows, AMD stock is now touching the resistance line drawn through the last two peaks in June 2000 and March 2006. It is hard to tell if AMD is going to reverse from this line or slightly breach it first, but if history is any guide, at current price levels the stock is carrying more risks than potential.
Did you like this analysis? Learn to do it yourself with our Elliott Wave Video Course!