AT&T stock reached $36.43 On June 25th, but has been declining ever since. Yesterday, prices fell to $33.44, so the majority of market participants is slowly switching its outlook from positive to negative. But let’s take a look on the weekly chart of AT&T, which will allow us to form our own opinion.
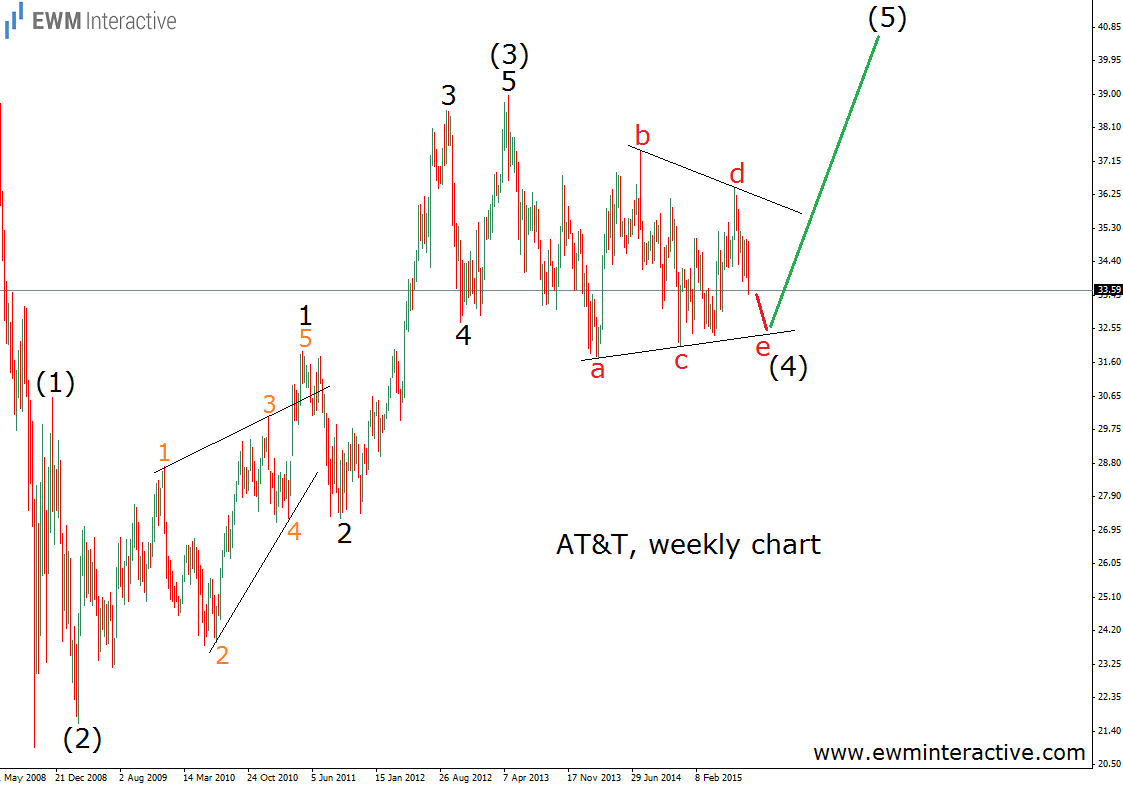
As visible, AT&T has been rising since the bottom at $20.96 in October 2008. In April 2013, the stock climbed as high as $38.98. Prices have been consolidating between $39.00 and $31.70 for more than two years now. However, the Elliott Wave Principle suggests the bulls might return soon. The entire advance since 2008 looks like an unfinished five-wave impulse. Unfinished, because its wave (5) is still missing. Wave (4) seems to be a triangle, whose last wave “e” is still in progress. If this is the correct count, once it is finished, AT&T could be expected to head north again. As long as the bottom of wave “c” of (4) is safe, the 40-dollar mark remains as a long-term target.